Lab 1

*I am proud of one blue-circle drawing that was timed for five minutes. Because it is where I started catching on—following directions, and creating “art.”

*The most important thing (other than the trip itself) is safety. My entries would take into account Shell gasoline stops being predetermined: during daylight, with Subways or McDonalds, and only in suburbs.

My Data Diaries project will use #6, #10, and the #18 exercises.

lab 1

I chose drawing of excited circle in exercise showing emotion through drawing simple shapes because circle is one of easier shapes to draw and I am left handed. Circles are round and are similar to draw if you are left or right handed.

My schema is how many cities were stopped at in states, how many gas stations were stopped at, and what were the total gas prices. Other schema are what start dates and end dates are by time zones and how many hours you are on road.

Three exercises I will use for data diaries project are my travels, what I eat, and my time alone.

Image preview


Lab 1

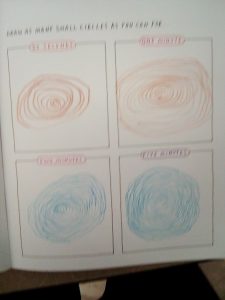
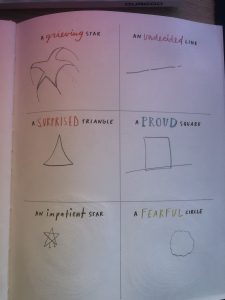
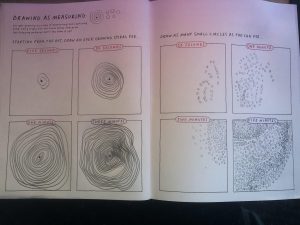
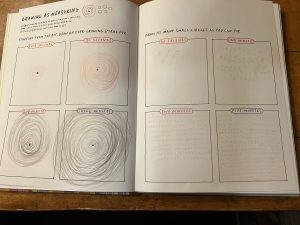
I enjoyed many of the exercises in the “Learning to See” chapter of Observe, Collect, Draw! including the emotion through shape exercise and the rhythms of the body. These allowed me to be creative and present data in ways that I would not normally think about. I was surprised to find that the exercise that I struggled with the most was the drawing as measuring exercise. I like structure and routine; however, I found this exercise a little tedious and time consuming. I found that drawing a spiral for three minutes and small circles for five minutes difficult (not to mention that my hand cramped).

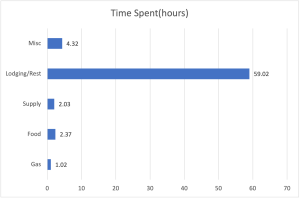
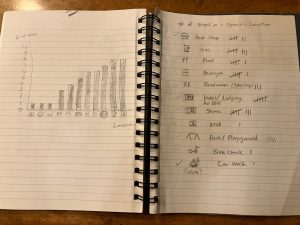
If I was to create a schema for the vacation log, I would create a bar graph that represents the number of stops at a specific location. For example, I would utilize symbols for each location including rest stops, gas stops, food stops, restroom/potty stops, etc. I would then log the number of stops in each category by using lines/ticks. To complete the bar graph, the symbols would represent the horizontal values of the graph and the number of stops in each category would represent the vertical values completing a bar of different heights for each category.

The three exercises that I will be completing for the Data Diaries project will be Exercise 2 (Birthdays), 15 (My Swearing), and 18 (Distractions).


Lab 1

  • I chose the exercise listed below because I struggled to focus on keeping track of my breathing, blinking, and pulse while also trying to mark the text.
  • For my schema I would set up categories that create a distinction between the various types of stops such as gas, food, lodging, etc and then collect the amount of time spent participating in each activity for the duration of the trip. I think this bar graph that I made to represent said schema is pretty cool so I linked it below also.
  • Finally, the three exercises I am going to participate in are #10 my past, #15 my swearing,  and #22 what I eat.


  • image0.jpeg

Lab 1

Morgan and I sorted the data we received by the danger of every given stop. 80% we deemed safe, 15% was 50/50, and 5% was actually dangerous. We made a pie chart that showed this. I was pretty confused, at first, as to what I needed to do with the data. This was because I had no idea how to creatively represent the data or what schema to place on it in order to organize/ make sense of it. The exercise I wanted to highlight was the one trying to draw emotion through simple shapes. The idea is to project emotional states back onto a variety of shapes and see how creative one can be. I am not very creative, so it was pretty difficult for me to get the hang of it. Overall, I thought it was interesting, and by the end of this class in December, I hope I can at least a little bit more creative. For my data dairies project that I have to do, one of the projects that I will be doing is the “#6 My Books”. I do not have a very large amount of books, especially not down here in Tuscaloosa, but I really do enjoy reading. I think it would be cool to have all my books mapped out on paper. The second exercise is the “#17 My Inbox” which is the most interesting to me out of the three that will take 1 day. Third is the “#18 Distractions”, which will take 5 days. I would like to do this one just to help with my time management.

Data Lab1

These are the two exercises that stood out to me. The one on the left challenged my creativity, especially the “impatient star”. The exercise in the picture on the right, “Drawing as Measuring”, was challenging for me because I am naturally lazy. Drawing little circles for five minutes straight made me feel like I was going crazy, same with the spirals. I did miss class so I may be off base here. For a schema for a travel log, I would make one including the location traveled to including a picture (if available), how long the stay was, where the person traveled from, and where they went next. I think the best way to show this would be a star type shape, with paths branching out from a central base with the hope that it would avoid too much redundancy. Finally, for my data diaries project, I will be using the following exercises: #3, #6, and #28.