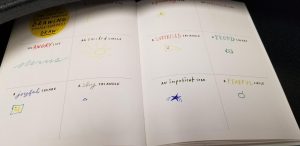
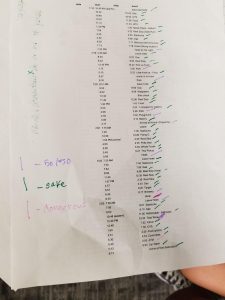
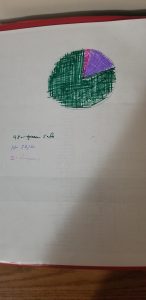
Morgan and I sorted the data we received by the danger of every given stop. 80% we deemed safe, 15% was 50/50, and 5% was actually dangerous. We made a pie chart that showed this. I was pretty confused, at first, as to what I needed to do with the data. This was because I had no idea how to creatively represent the data or what schema to place on it in order to organize/ make sense of it. The exercise I wanted to highlight was the one trying to draw emotion through simple shapes. The idea is to project emotional states back onto a variety of shapes and see how creative one can be. I am not very creative, so it was pretty difficult for me to get the hang of it. Overall, I thought it was interesting, and by the end of this class in December, I hope I can at least a little bit more creative. For my data dairies project that I have to do, one of the projects that I will be doing is the “#6 My Books”. I do not have a very large amount of books, especially not down here in Tuscaloosa, but I really do enjoy reading. I think it would be cool to have all my books mapped out on paper. The second exercise is the “#17 My Inbox” which is the most interesting to me out of the three that will take 1 day. Third is the “#18 Distractions”, which will take 5 days. I would like to do this one just to help with my time management.