This semester, I have been introduced to and exposed to digital humanities for the first time. Throughout the course, I have come to understand digital humanities as a way to combine a field that is very well known for accuracy, data, and statistics with a field loved for its ambiguity, interpretations, and depth. Within the study of religion, I think digital humanities is a way to put an excess of written word and experience into an aesthetically pleasing visual interpretation. I believe these interpretations allow people who may not be well-versed in the field of humanities to understand the fluidity of data. When I think about digital humanities and religion, I come back to the visualization we looked at in class where you could filter through different religious groups and different media surrounding them. I believe one of them was looking at Seventh-day Adventists and there were sounds, photographs, and texts. The idea that religion with so many contributing factors can be almost summarized into data visualization is very intriguing. There is a lot of insight that you can gain from data–I believe it just requires a little bit more effort with respect to looking at data and humanities. Aside from learning what digital humanities is, something else I found to be interesting during the course was the different ways in which people utilize this data to benefit a certain cause. Specifically, when we were looking at big data and ideas such as this, it was interesting to see the variety of people using digital humanities. One of the most compelling aspects of digital humanities that we learned through this course was looking at the Native American view on DH and how data can be used for both good and bad. I believe that this reading/example conveys the most useful interpretation of digital humanities in relation to religion and culture.
Category: Lab
Lab 10
My research for my final project is over, and now I am deciding how how I want to dissect the data. I have been exploring what Voyant can do with texts, since that is going to be the main website I use for my project. I thought about going through each of Plato’s books in the Republic and see what words are the most used in each section individually to help me see if there is a pattern. I noticed when I looked at all of the books together in Voyant as a long text file, I saw that the word “true” was used very frequently. I thought about going through each book and mapping out which words are used most frequently with “true” and see if I could graph them on one of the cites we used several weeks ago. I am not set on this, but it is a very viable option.
Lab 10
I have all data and information for my essay about my Scots Irish ancestors. One of my research questions is who are Scots Irish. Scots Irish are Scottish who moved to Ireland by potato famine and left for America in 1717. One of the visualizations I will use in my Scots Irish essay is map about where Scots Irish lived in United States. I would use maps and pictures on Scalar that I have on Omeka.

Lab 10
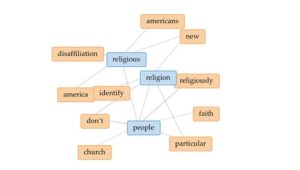
When approaching this project, I chose to research the religious distribution in the United States. I was not only interested in the current religious landscape, but I also wanted to look at the history of how the dominant religions came to be in our country as well as what trends were predicted in the future with respect to religious distribution. I found that there was quite a bit of data on the historical formation of religions in this country. There was also a fair amount of data that was available for the current religious landscape. Many of the resources I found featured data collected through public research institutes and independent analytics/polling companies. I was surprised to learn that a pattern has recently emerged where a larger percentage of the population considers themselves religiously unaffiliated as well as a decline in those who identify as Christian. Surprisingly, numbers for the other two dominant religions, Judaism and Islam have remained relatively consistent in a steady increase over time. I still struggle with the Flourish program; however, I have found using the Voyant-Tools has been much easier. I also have found Scalar to be user friendly. Here is a Voyant visualization I plan to use in my final project.
Lab9
I chose to use a bunch of essays from one of my courses in voyant. They are not all the best written, but they are short little reviews of different movies that we watched. The visualization is showing that I need to get better at writing ): I used some words too frequently, and also some of my essays are not very readable according to voyant. I am interpreting the information shown on voyant by clicking through the different tabs to try and find what makes most sense. I think if I had a slightly larger sample size I would be able to better understand the trends shown.
Lab 9
https://voyant-tools.org/?corpus=7e21d3b4fe9e3d7e09bddbdc41e914bf&visible=125&panels=cirrus,reader,trends,phrases,correlations&view=Cirrus
For this assignment, I compared two texts Irish mythology and The Characteristics of Irish Folklore. I tried to play around with the graphs and charts but I think the cirrus (word trend) was the best visual representation for showing trends between these two. Since the subject I’m looking at is vast and there are multiple interpretations, I find the words commonly associated with both texts to be intriguing and very telling regarding Celtic folklore. I’m interpreting the data by looking at words most commonly used \ to better understand what folklore is to begin with. Words such as tradition, local, dead, custom, gods, power, and stories are very indicative of the culture embedded in mythology.
note: there are a few words in there only because they come from the source such as Jstor, NOV, 2022. I couldn’t figure out how to remove them completely. I tried to go in and select certain words to show up but the visual did not match that so disregard those until I can figure out how to remove them from the visual.
lab 9
iframe style=’width: 401px; height: 264px;’ src=’https://voyant-tools.org/tool/Trends/?query=www&query=uah.edu&mode=document&corpus=5c54938cfa68f0eba7fe362475f514b4′></iframe>
Visualization that is informative is graph. UAH.edu is on 0.5 frequency by 2nd 5th and 7th segments.
Lab 9
https://voyant-tools.org/?corpus=d99361159cbe45ca7b0f9df52464b8d1&view=Cirrus
I enjoyed working with the Voyant-Tools program. I found Voyant to be very user-friendly providing several options for visualizations. I chose the Cirrus format for my visualization, which consisted of a display of words that predominantly occurred in the text of one of my reference website articles, “A Brief History of Islam in the United States.” I felt this graphic was unique in its impact as a visualization showing key words that were repeated in the article, displaying them in a fun and colorful format. The Cirrus visualization also differed from the traditional graphs and charts that we typically see when showing data, so this also appealed to me. I guess the one confusing aspect of this visualization would be determining the context of the article since it is a keyword display; however, I also find this interesting because it leads the reader to explore more about the topic.
Lab 9
This is an image of the most common words found within all ten books of the Republic. I pulled all of the dialogue in the books and had the program ignore the words said, say, and book. Because this is a long conversation between Socrates and others, the words say and said are used very often but they do not do anything to tell us what the Republic is about. I removed the word book because it was used only in the titles. The goal of this is to use it in my final project to see if the words mot often used can tell one something about Plato’s work. I think the visual shows the words true, good, state, yes, and man are the most common words. This seems to be accurate as to the message of the Republic.
Lab7
I’ve been collecting loads of data for my project. I am gathering information on movies with dialogue that says “Jesus” or “Jesus Christ”. I am entering the films’ title, director, year released, genre, and the full quote that includes those words (also a small video clip from each movie with the quote). I also have the time (ex. 0:50:49) for when the quote appears in the film, but I don’t think that will be that useful. I am hoping to find a correlation in year and genre with the frequency of films that have used those words. There may be zero correlation, but I thought it would be interesting to see if the data has any significance.