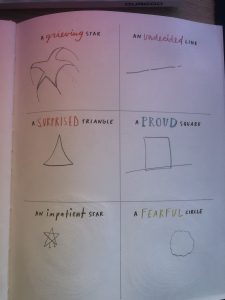
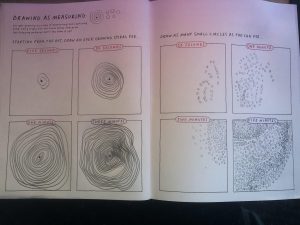
These are the two exercises that stood out to me. The one on the left challenged my creativity, especially the “impatient star”. The exercise in the picture on the right, “Drawing as Measuring”, was challenging for me because I am naturally lazy. Drawing little circles for five minutes straight made me feel like I was going crazy, same with the spirals. I did miss class so I may be off base here. For a schema for a travel log, I would make one including the location traveled to including a picture (if available), how long the stay was, where the person traveled from, and where they went next. I think the best way to show this would be a star type shape, with paths branching out from a central base with the hope that it would avoid too much redundancy. Finally, for my data diaries project, I will be using the following exercises: #3, #6, and #28.