Digital Humanities has been pretty cool this semester and it totally deviated from what I thought it was going to be. At the beginning of the semester, I was genuinely concerned about this class requiring a ton of coding and learning to use applications and software systems that frustrated me in high school when i initially tried to learn them. That was not the case. I had a pretty bad understanding of what DH really was until recently. I think that at least according to my own definition, Digital Humanities is a more advanced approach to the work that has been and is done in the field of religion for as long as its been around. Moreover, I would define Digital Humanities as a more tangible approach to understanding the complexities of academia through the presentation of data that seeks to better represent large quantities of data. I found that I learned all sorts of cool stuff about APIs and Big data, I furthered my ability to do effective research, and most importantly, I learned how to input the things I’ve gathered in my research and put them together in such a way that I would be able to provide some really cool visualizations (I think). The greatest way to argue that this fits into the study of religion is simply to look around the department here at the capstone. For example, the projects we focus on in this class are great examples as they’re directly related to religion. Even further, the department focuses on its podcast and the faculty are undoubtedly critical components of projects like The Religious Studies Project and others like Uncivil Religion which both rely heavily on material derived from the skills we’ve developed in DH this semester.
Author: amkelpe
Lab 7
My project is going well, though finding texts/ other kinds of relevant data is proving to be rather difficult. I am working on mapping various antisemitic publications in Europe before, and during World War 2. I plan to use a heat type map to show the places that published the most during this time period. My biggest concern with my project so far is mostly related to the gathering of data, though I’m sure with time this will resolve itself.
Lab 6
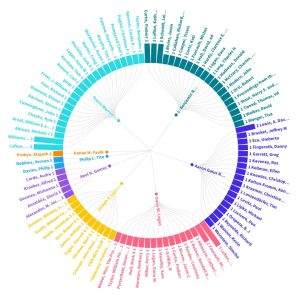
I took the data from the bulletin and put it back into flourish, and in doing so, I attempted to better visualize which sources were cited by authors and how many times. I was a little bit frustrated because I had similar issues to the ones faced in class where I would copy and paste something incorrectly or include the wrong header.
I think my graph demonstrates to the reader how many sources an author actually uses when writing articles and essays. In gathering research items for this class I was reminded of how much stuff goes into a piece of work that’s to be presented. Hopefully this graph demonstrates something to that effect.
Lab 5
Mukurtu has a ton of additional metadata that Omeka does not. For example Mukurtu includes metadata fields like: Media Assets, Cultural Narrative, Traditional Knowledge, and Communities and Protocols. This appears to me as though Mukurtu is a much more specialized system than Omeka, or rather that it was designed specifically for this purpose.
It seems to me that Omeka is supposed to be a relatively barebones system designed for projects focused on large scale projects where the details of community aren’t as strongly expressed. The Omeka model for gathering data appears also to be focused mainly on the collection of various texts rather than media as a whole as is demonstrated in the Mukurtu model. Moreover, Mukurtu demonstrates a bias towards a specific community and as such their metadata is set up to expose the intricacies of that community.
Lab 4
Given what we’ve been going over in class so far, I think that I’d like to look into a project having to do with text analysis. Moreover, I’d like to look at antisemitic texts and newspapers published during the time of the Holocaust and then in the same way apple does, create a map that allows the viewer to see where in the world the texts originate from.
To work through this project I’ll need to gather data from what I can only assume are archival collections. I think a good place to start would be with the Holocaust commissions around the United States.
Lab 2
I looked at jsLDA and their goal is to model data in text. It takes documents (not documents in the way we know them, but rather, chunks of texts) and uses various stop words to sort themes. For example one that the website talks about is studying how certain themes came up in the state of the union address and classifies them by category.
In my opinion the project was very cool and it even had a user-end interaction option. However, the website lacked substance. The project was there but the presentation lacked anything of any real excitement value. Additionally, the site only has one page. It offers little information, poorly explains the purpose of the project, and presents it’s user interface in such a way that it seems almost disinteresting.
Lab 1
- I chose the exercise listed below because I struggled to focus on keeping track of my breathing, blinking, and pulse while also trying to mark the text.
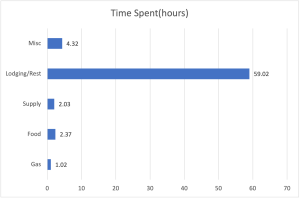
- For my schema I would set up categories that create a distinction between the various types of stops such as gas, food, lodging, etc and then collect the amount of time spent participating in each activity for the duration of the trip. I think this bar graph that I made to represent said schema is pretty cool so I linked it below also.
- Finally, the three exercises I am going to participate in are #10 my past, #15 my swearing, and #22 what I eat.
My Introduction
Hey guys my name is Andy, I am a senior here at UA majoring in Religious Studies with a minor in Jewish Studies. I took this class because I wanted to be able to in a way get lost in research and build a really cool project in a way that I haven’t before. I’m looking forward to this semester with y’all, it should be a pretty good time.
The following gif is how I feel every time someone reminds me that I’m graduating this spring.