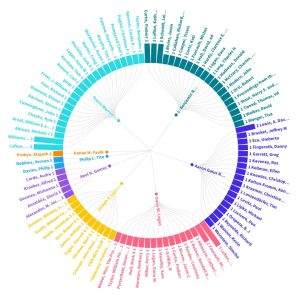
I took the data from the bulletin and put it back into flourish, and in doing so, I attempted to better visualize which sources were cited by authors and how many times. I was a little bit frustrated because I had similar issues to the ones faced in class where I would copy and paste something incorrectly or include the wrong header.
I think my graph demonstrates to the reader how many sources an author actually uses when writing articles and essays. In gathering research items for this class I was reminded of how much stuff goes into a piece of work that’s to be presented. Hopefully this graph demonstrates something to that effect.