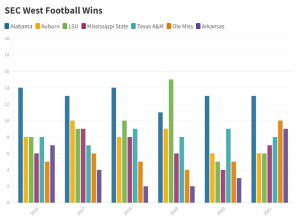
Well, I tried to figure out what I did wrong with the visual that I made from class this past week, but I could not do it. I had to fall back on something last minute since I was not sure where to pull new data from last minute like this. I decided to chart the wins off all the SEC West football teams wins over the past 5 years and divide them up by teams. Of course Alabama is predominantly on top (roll tide), but there was some fluctuation between between LSU, A&M, Auburn, and Ole Miss. Referring to the assignment in class, it is far more complicated than the graph that I have at the bottom since there was so much more data. I did learn a lot using Flourish and how it will relate to Omeka for my final project. My final project will likely be a some sort of bar graph representation, so I am glad to have worked with it when it for this small representation.