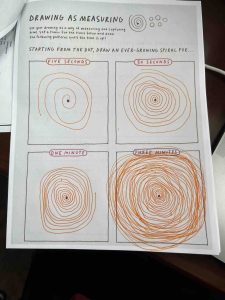
I choose to highlight this exercise because it demonstrates how important time when dealing with data. When time is not important, the spiral is very loose and with a lot of space in between. When time is the most important component, the closeness becomes very precise and crucial.
For the schema, I would look at how much time was spent actively driving vs how much time the car was parked. This would be fairly straight forward as I would go down the list of times and note when the car was a rest stop, getting food, getting gas, etc. I would then total that time and the time spent driving which is indicated by the long stents in between stops. For the data diaries, I will be doing “How many variations to a line”, “Draw your breathe”, and “Color palette testing”.