The goal for today’s lab is to walk through steps for assessing a data set, in terms of the quality or messiness of the data and in terms of the social, ethical, and contextual aspects of the data.
You will need Tableau Prep for this lab.
Orienting Ourselves to the Data (and Tableau Prep)
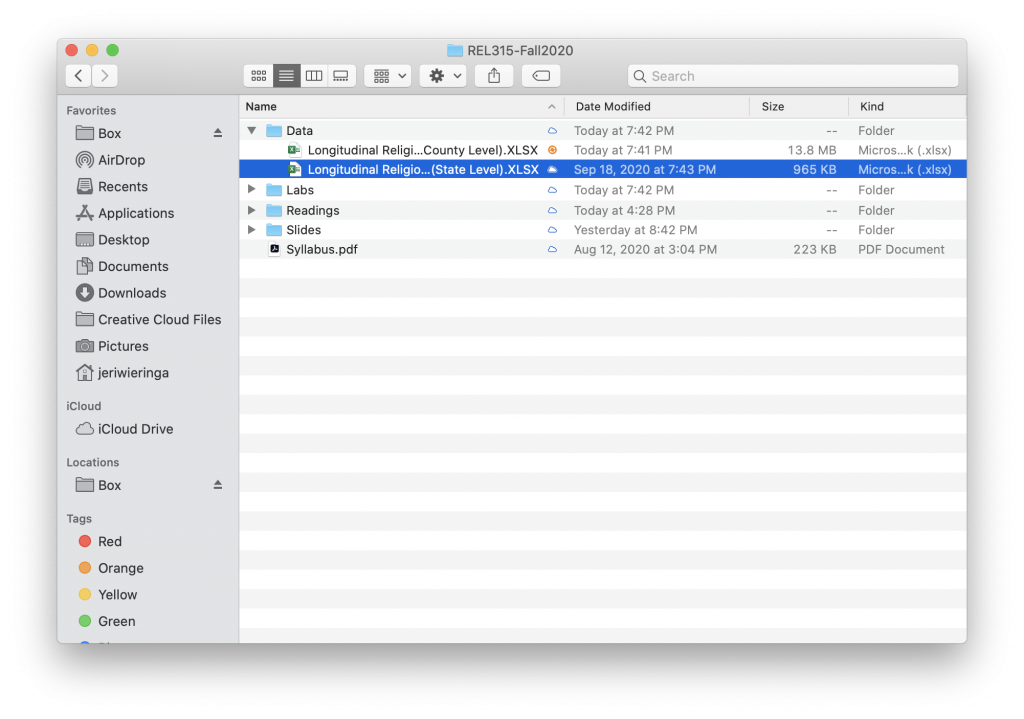
The data file for today’s class can be accessed at The ARDA website or is available in Box. We are using the “State Level” dataset in class because it is a bit smaller and so makes it easier to see what is going on. For your final projects, you are welcome to use the county level data for a more nuanced view.
To get a sense of our the data, let’s fire up Tableau Prep!
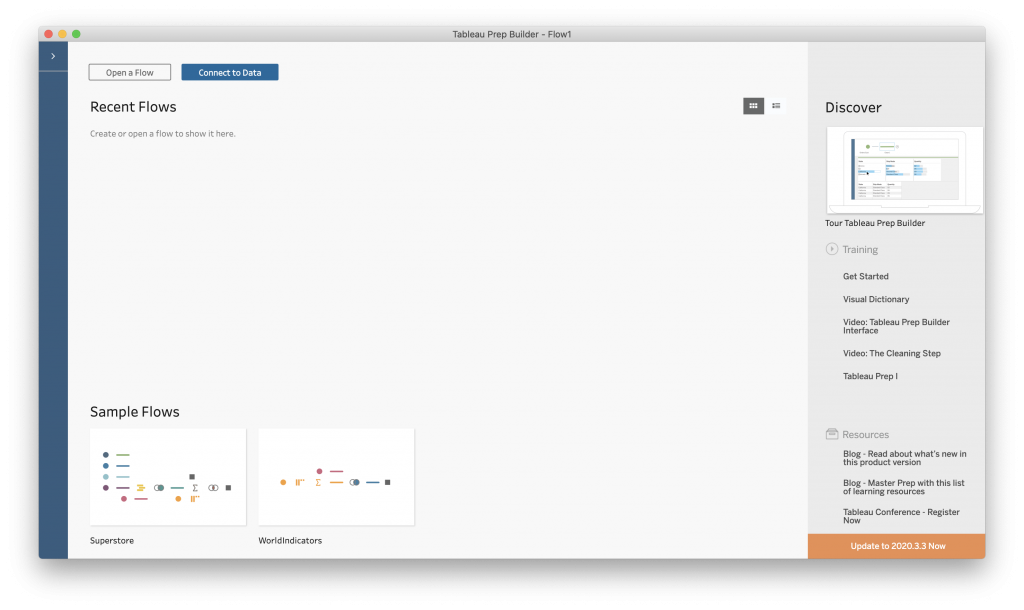
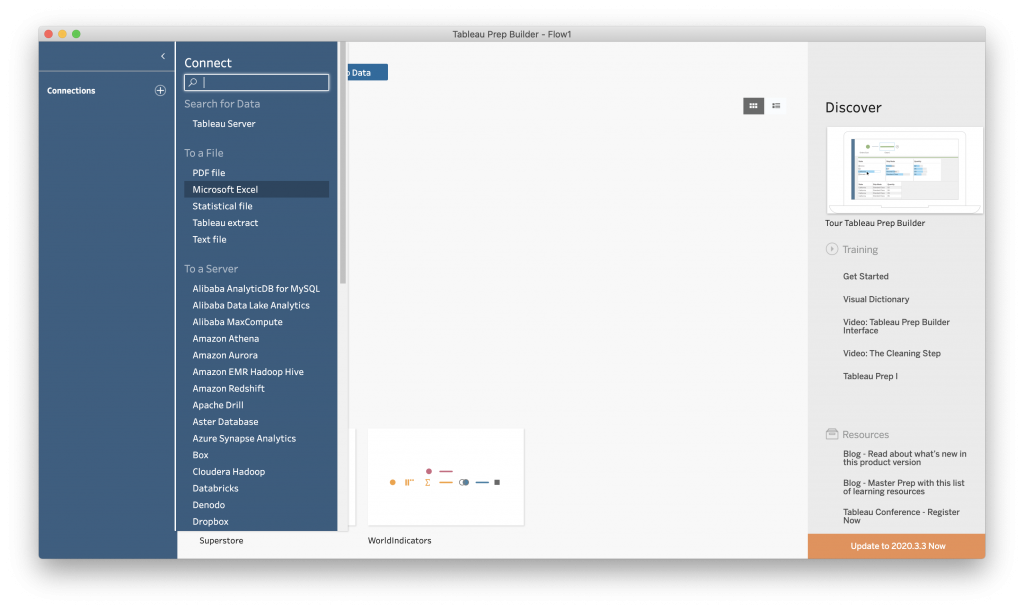
Select “Connect to Data” and choose “Microsoft Excel” under “To a File.” (Tableau Prep lets you work with data in many different formats and stored in different types of locations.)
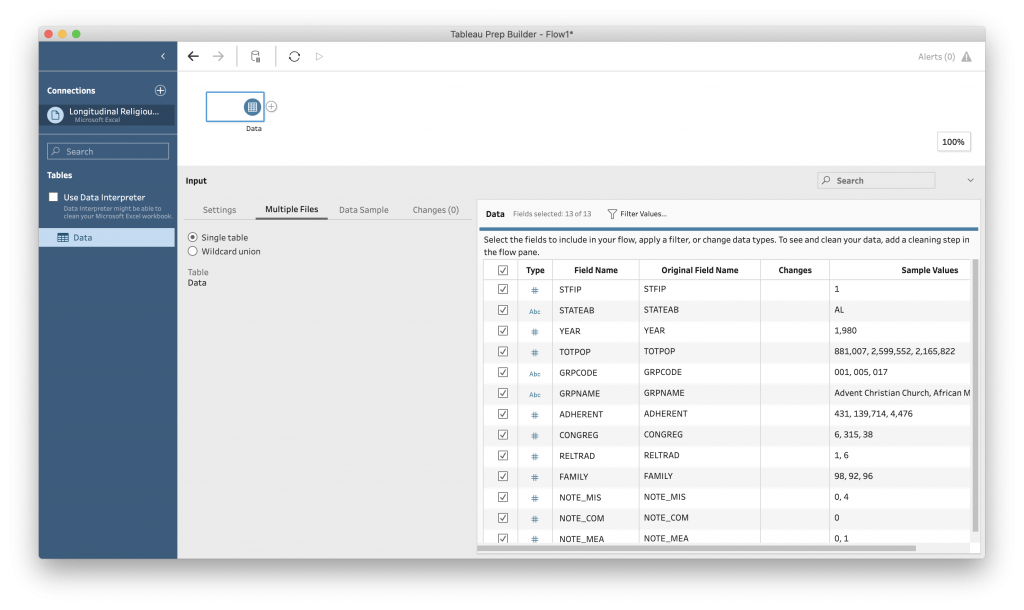
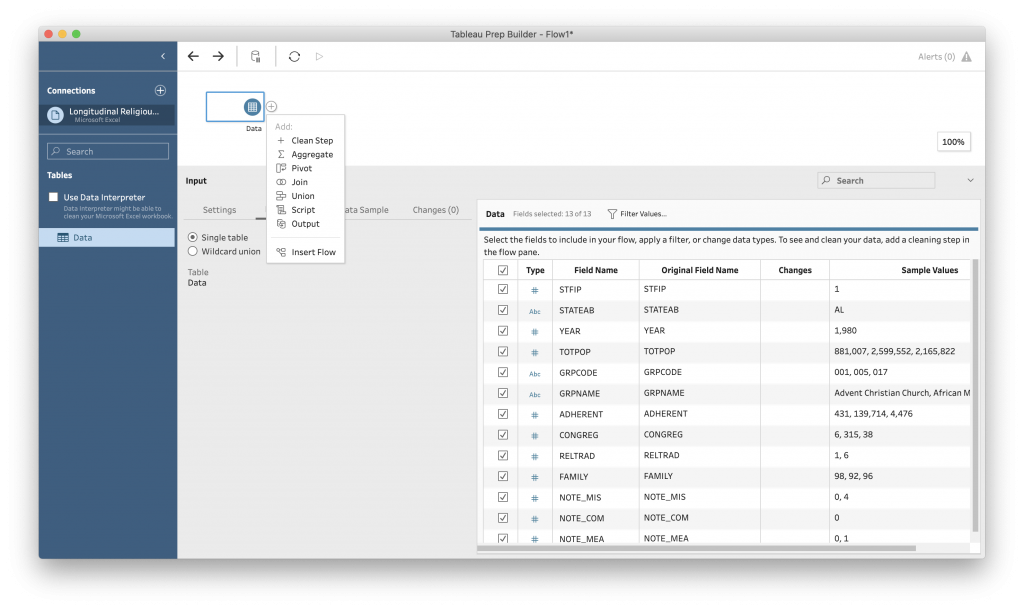
This interface gives you a quick overview of the fields and values in your file, as well as allows you to control how Tableau connects to the data and connect multiple data files together. This data exists in one table and is not changing, so we don’t need to worry about “Settings” or “Multiple Files.” It is also a rather small dataset so we do not need to create a “Data Sample.”
To start working with the data, click the “+” next to “Data” at the top of the window and add a “Clean Step.”
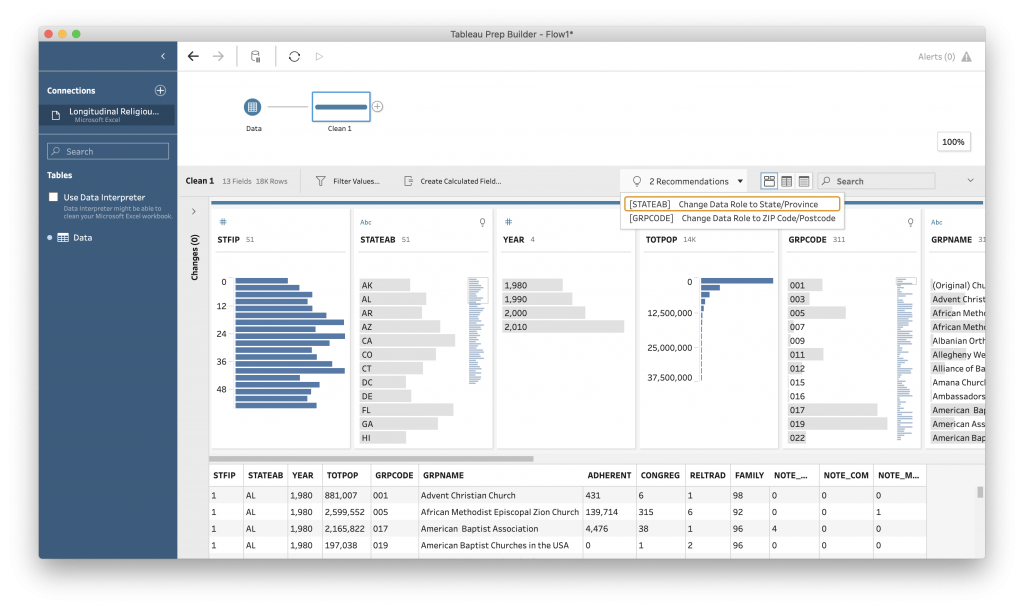
This opens up an overview interface for examining the range of data in the file. Many of the facets is a histogram, where rather than giving all of the counts, it divides the data into ranges and tell you how many of the values fall within that range. This lets us see overall trends, like a gradual increase in the number of churches reported, an overabundance of small churches, and that the largest reporting group is “RELTRAD” 1 (which the codebook tells us is “Evangelical Protestants.”)
In this interface you can make adjustments to the data to make it easier to work with for analysis and visualization later. For example, Tableau has guessed at the data type for each variable (is it a number, a word or string, etc.) There are specialized data types, such as dates or geographic information, that you can identify a column as representing, which will open up different types of analysis.
What I like about this interface is that it tracks every change you make to the data, and you can save a sequence of changes as a “flow” that can be applied to new data files.
We will go head first into cleaning data in two weeks. For now, we are just looking around.
We can get a partial picture of what is going on with the data by looking at it. The data also comes with context in the form of a codebook. The codebook should tell you things such as:
- What the variables represent
- How the variables are measured (what kind of number is it?)
- What the codes represent
- When and how the data was created
For this dataset, the codebook is easiest to access through the ARDA website – https://www.thearda.com/Archive/Files/Codebooks/RCMSMGST_CB.asp
Here we learn what the category codes mean, such as for “Religious Tradition” (RELTRAD) and “Religious Family” (FAMILY). We also can decode the flags that tell us about how changes were made in creating this longitudinal dataset.
Data Quality
Now that we can see our data in Tableau, we can begin to ask some questions about its structure and quality.
- Are there changes needed to make the data tidy?
- Are there over- or under-represented groups?
- Is there missing data, i.e., “null” values? Can we determine why they are missing?
- Does the data pass the “sniff test”? Does anything look wonky?
Data Context
To evaluate the context of our data, we will take our lead from Data Feminism:
“Prior to beginning the analysis process, Krause asks people working with data, particularly journalists, to write a short history of a particular dataset and answer five basic questions: Where did it come from? Who collected it? When? How was it collected? Why was it collected?” (Data Feminism, ch. 6)
Additionally we will ask whose goals are prioritized? Who benefits and who is overlooked? (Data Feminism, ch. 2).
Here these data are complicated. The longitudinal data was created by a team from four previously existing datasets. As we read in the summary, the data in those four original datasets was generated by survey and represents the self-reporting of the responding churches. We need to consider all 5 data creators when answering these questions.
Let’s start to work through these questions together.
Homework
For your lab assignment, create a blog post that offers an initial assessment of one of your candidate secondary data sources. Consider both the data quality and the data context. Your assessment can be informal, such as using bullet points under the framing questions. If you cannot answer a question after doing some due diligence, you can answer “unknown.” Inability to find answers to these questions if not uncommon and should factor into your evaluation of how (or if) you can use the data in your investigation.
The questions to consider are:
- Are there changes needed to make the data tidy?
- Are there over- or under-represented groups?
- Is there missing data, i.e., “null” values?
- Does the data pass the “sniff test”? Does anything look wonky?
- Where did the data come from?
- Who collected it?
- When?
- How was it collected?
- Why was it collected?
- Whose goals are prioritized?
- Who benefits and who is overlooked?