If you want to bring demographic information into your analysis, you will want to check out the National Historical GIS site, part of IPUMS. Even if you don’t think your data is “geographic,” you should double check with their holdings.
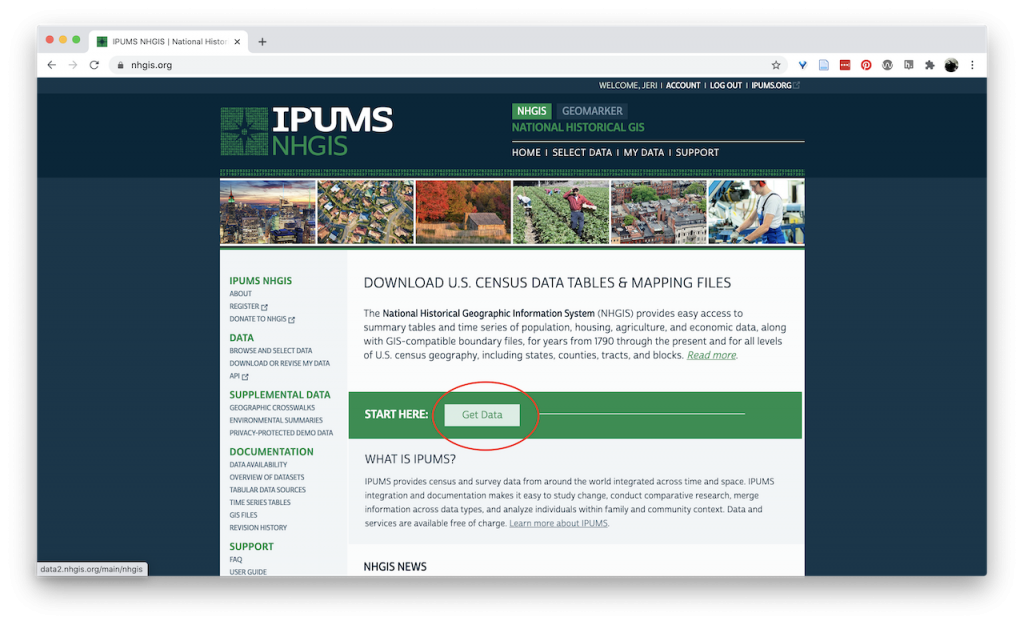
To get data from NHGIS, click “Get Data.”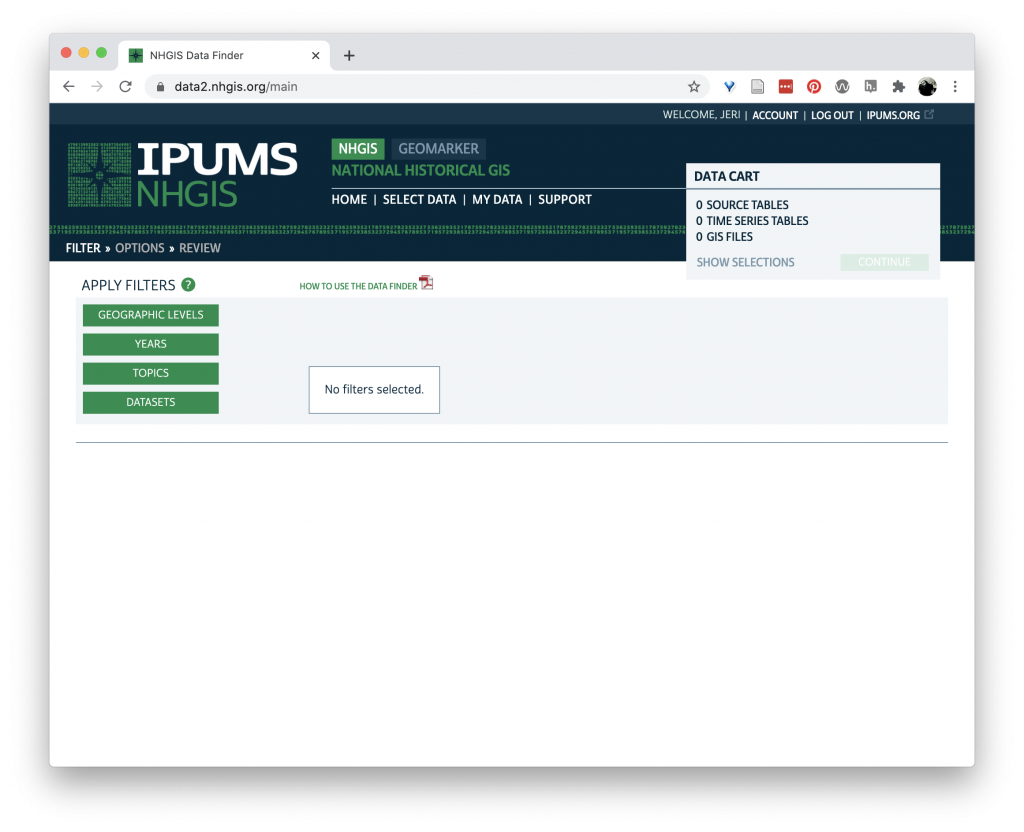
From here, you can choose how to filter the available data for that which connects to your areas of interest. Say you were interested in the demographics of Alabama in 1980. This give us a geographic, temporal, and topical constraint.
First, click on “Geographic Levels”
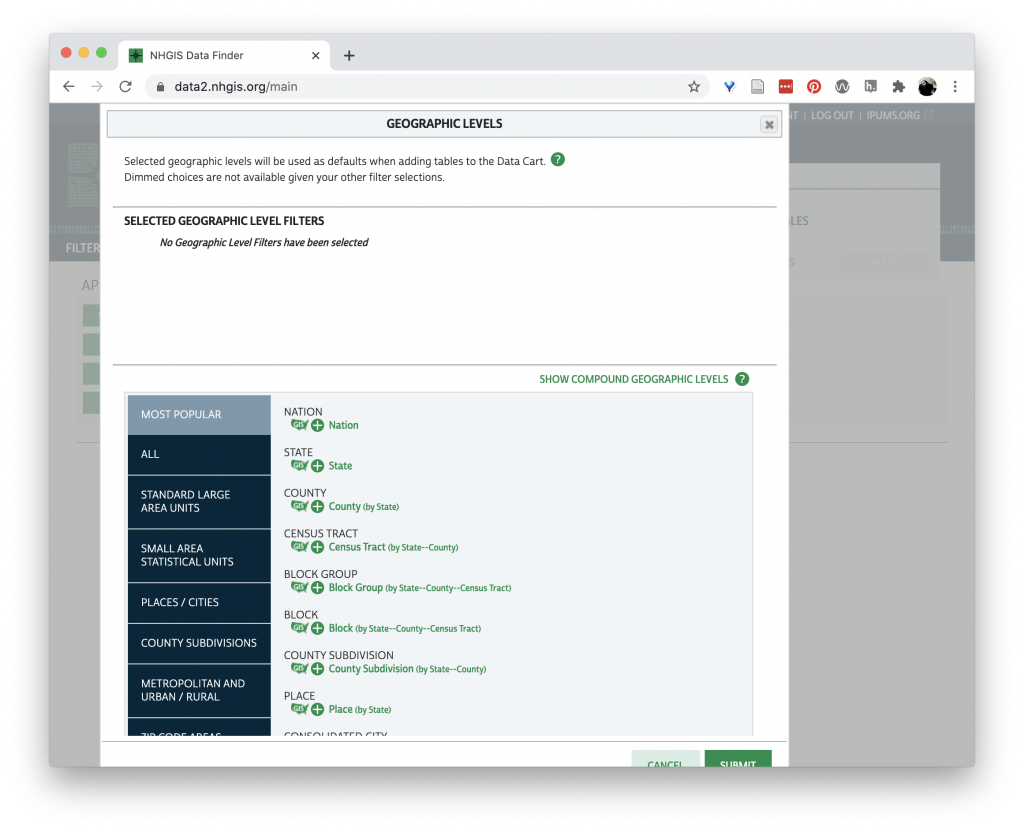
The more specific we choose, the fewer number of data sets will fit our criteria.
Let’s choose “County” by clicking the “+” under “County.” This transforms the “+” into a “☑️.” Scroll down and click “Submit.”
Now we have a table of potential datasets that meet our county level requirement. Let’s add a time filter.
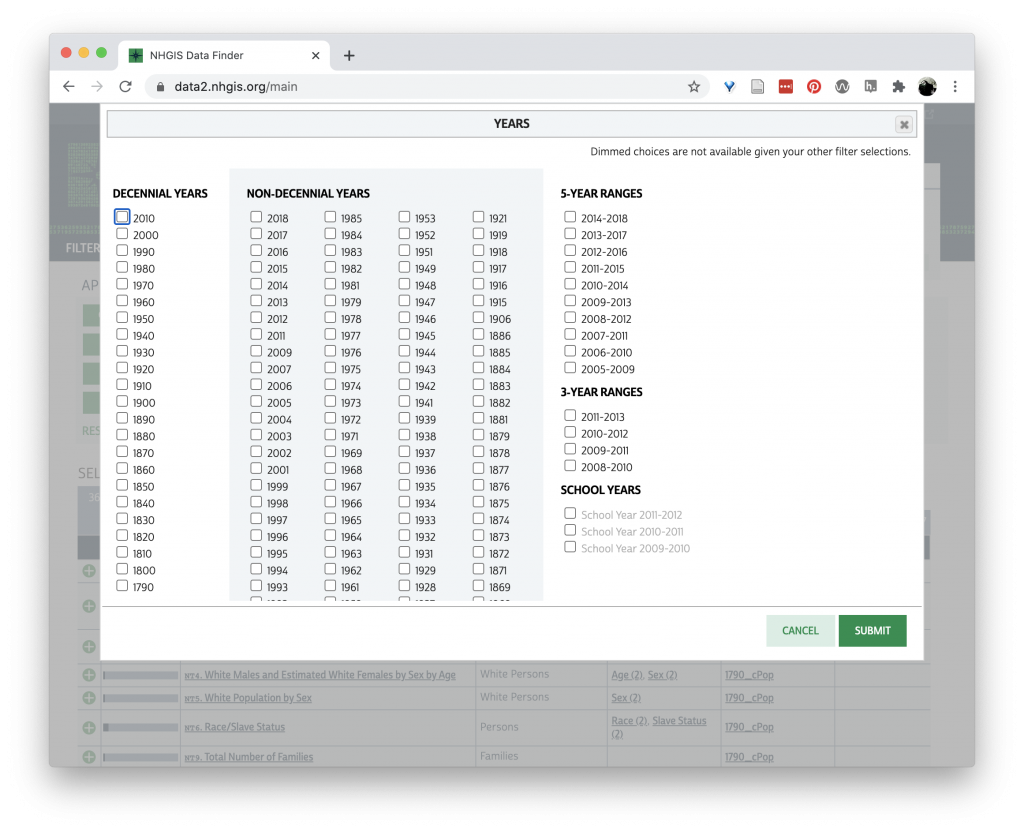
We can click to box under “Decennial Years” for 1980. Then click “Submit”
Now our list of available data is smaller. Let’s do one more filter, by Topic.
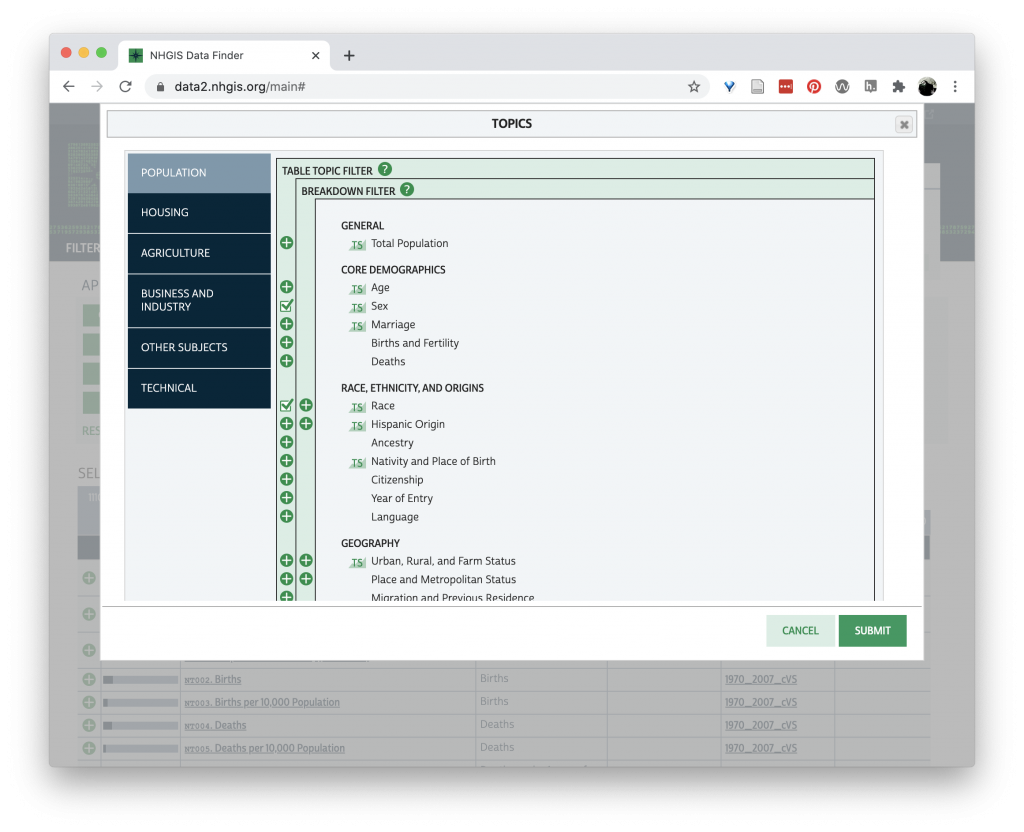
Here I have selected “Sex” and “Race” from the available topic filters. And click “Submit.”
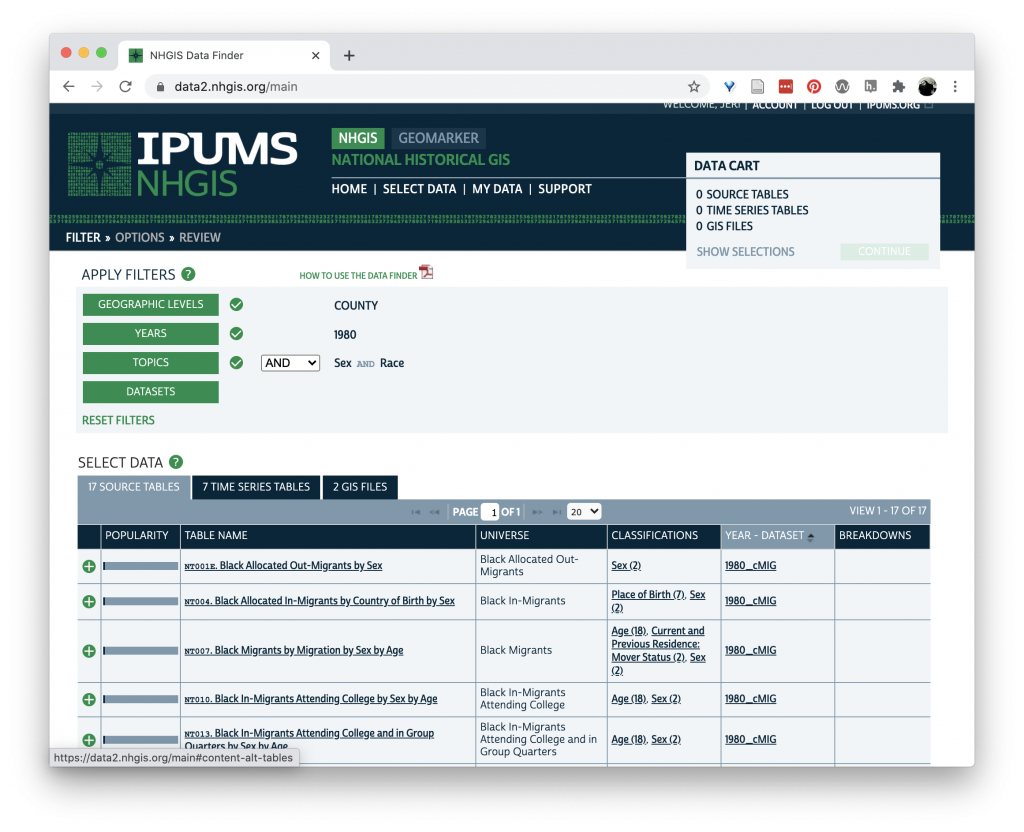
We are left with 17 source tables, 7 time series tables, and 2 GIS files. Of these, I find the time series tables to be a good place to start. Click on the time series tab.
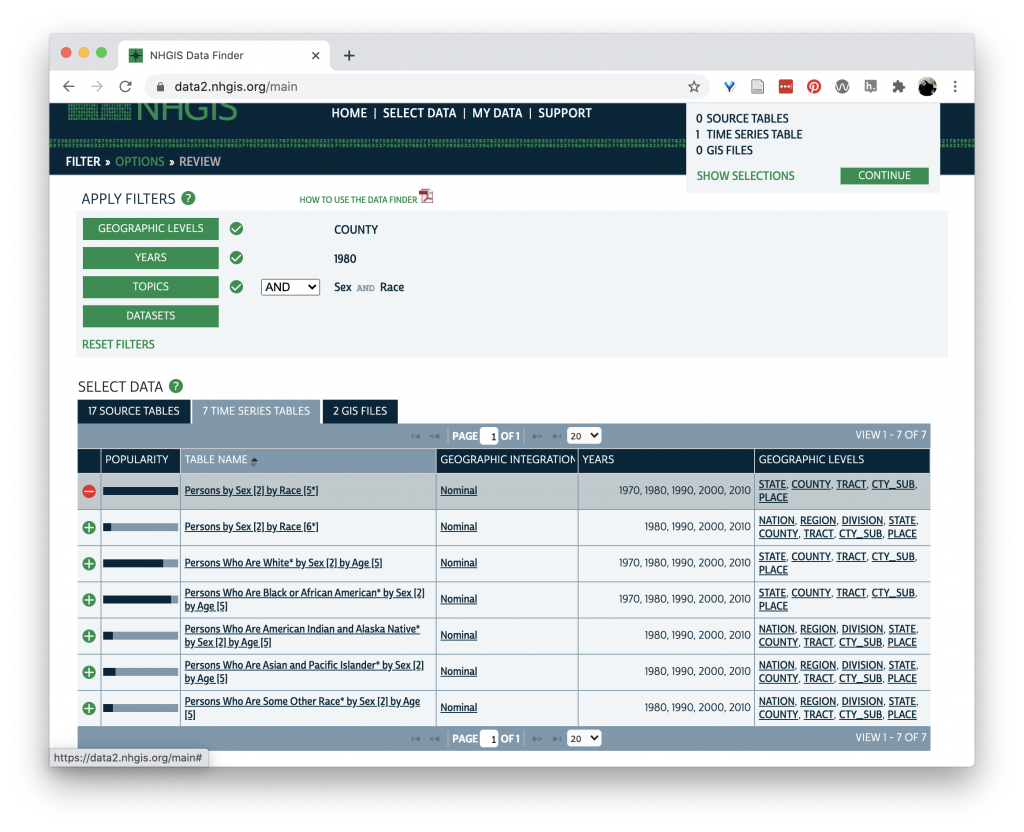
This table is telling us that there is data of “Persons by Sex” (of which there are 2 potential values (!)) by “Race” (of which there are 5 (!) potential variables). This data is for 1970, 80, 90, 2000, and 2010 and at the level of state, county, tract, city, or place. Clicking the “+” add the data to our cart.
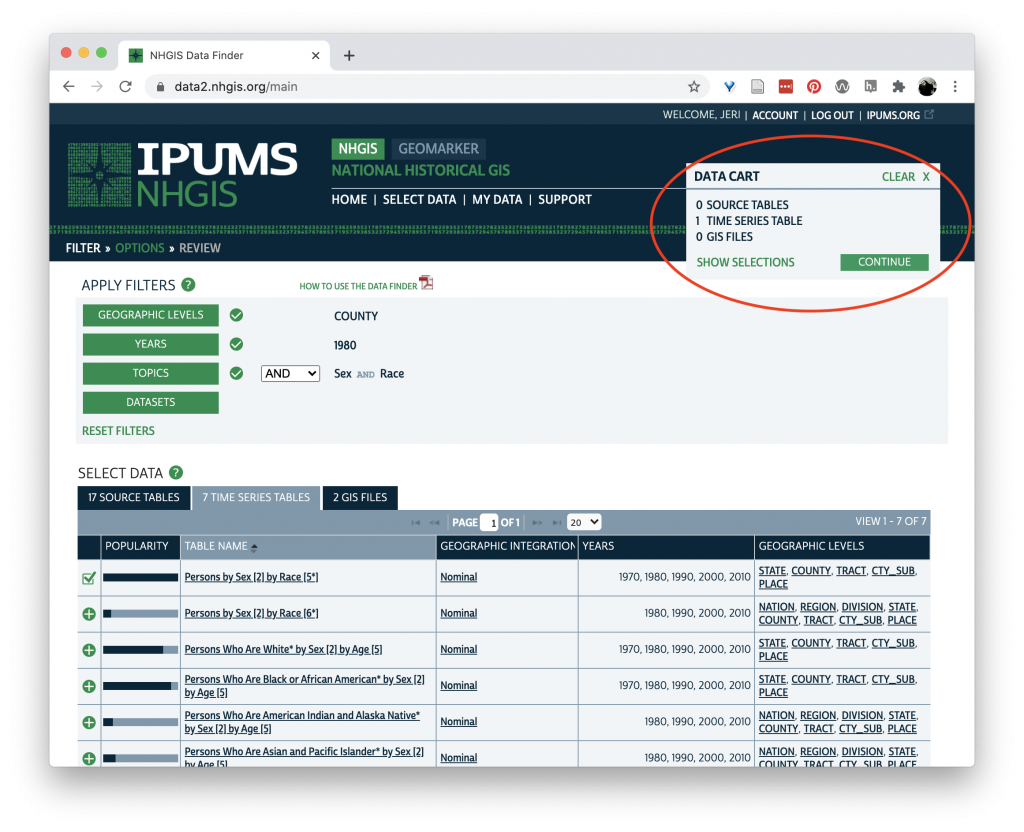
Click “continue” in your Data Cart.
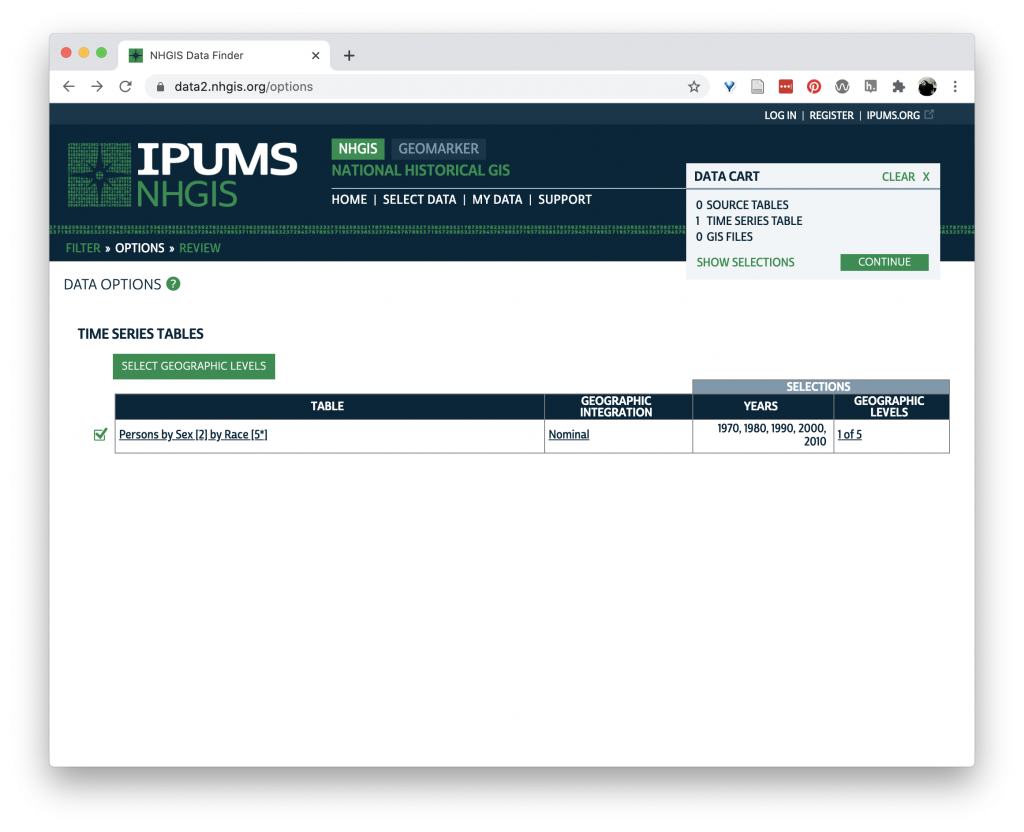
Here you can verify the data you are requesting. Because we selected “county” as our geographic level earlier, we are only getting 1 of 5 geographic levels of the data, though you can revise that here by clicking “Select Geographic Levels.”
If this all looks correct, click “Continue” in your data cart.
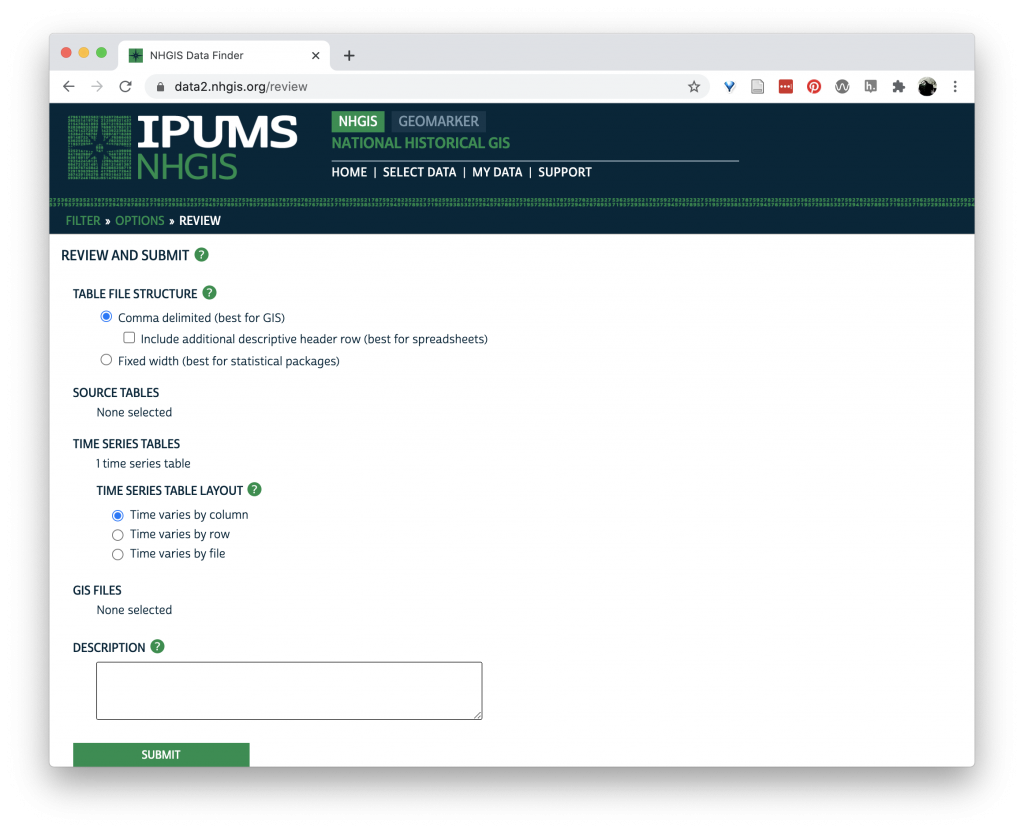
This bring you to the final screen where you can customize how the data is structured for download. It is good to stay with “comma delimited” (CSV). Because we are only interested in one year, change the “Time Series Table Layout” to “Time Varies by file” and click “Submit.”
To download the data you do need to create an account with IPUMS, which it will prompt you to do at this point.
Once you have logged in, you will see a table with the available datasets.
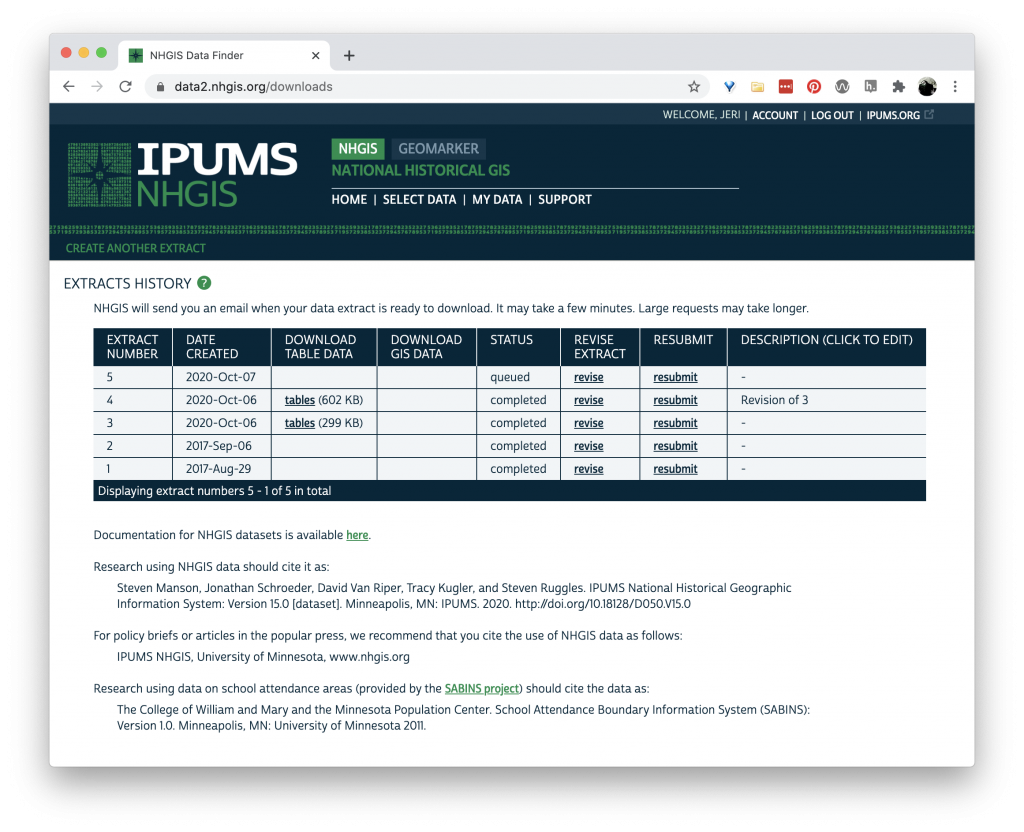
Once the data is available to download, it appears under the “Download Table Data” column as “tables.” Clicking this link will download the data to your local machine. This screen also gives you important information about citing this data.
If you want to change the parameters on the data, you can click “revise” to adjust your data. The data eventually times out, so you can “resubmit” to regenerate your data.
Now you can take your CSV file and the codebook and open it in Excel to view, or in Tableau Prep to add it to your ARDA data.