Your reading for today is Katie Rawson and Trevor Muñoz, “Against Cleaning.”
As you work with the class data and with your own data, Prepare Your Data for Tableau, chapters 6 – 10 provide further details on the different “cleaning” steps that we will discuss here.
So, what is data cleaning and why do you need to do it?
Think of data cleaning like editing and revising. The data file you are working with, whether you created it or downloaded it from someone else, was the first draft. Now you need to focus in on your thesis, rearrange paragraphs to make the argument easier to follow, clean up your grammar, and polish your prose.
Similarly, with data, you clean to focus in on the columns (variables) that help us answer our research question, reorganize to make it tidy, make the data consistent, and add some finishing touches, like data types, so that the data works well for visualization.
We are going to practice with a couple forms of data cleaning in class and your homework will be to practice on one of your datasets for your final project.
Types of cleaning
One form of cleaning that we have done before is creating tidy data. In Tableau, this is done with a Pivot.
Let’s look back at our data from Lab 4. Make a new copy of the Lab 4 Google Sheet (I’ve added two new tabs for today) and load them into a new session of Tableau Prep. (See if you remember from last week how to do that.)
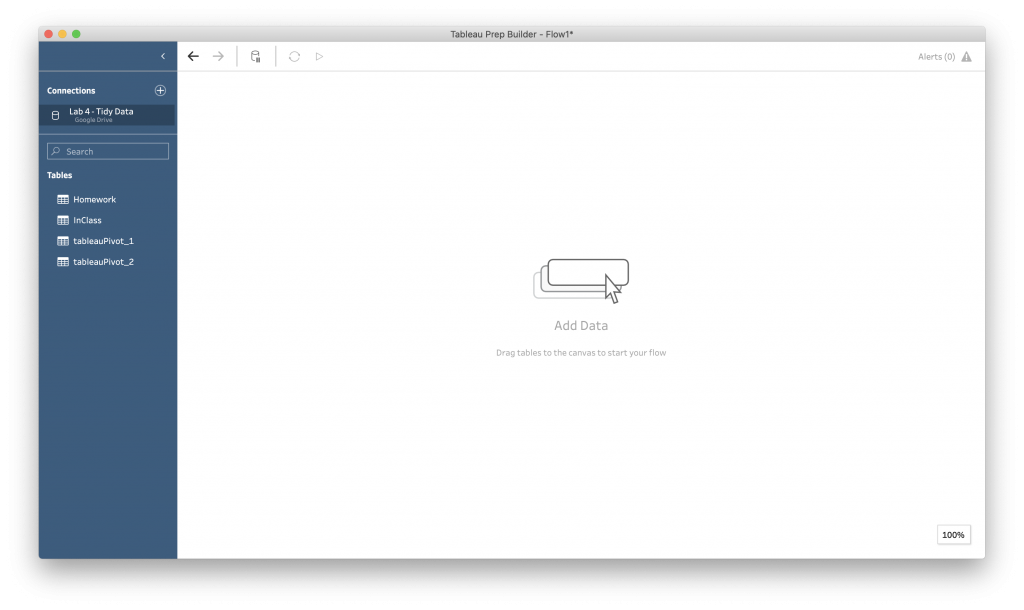
Back in week 4, we manually reorganized the data to make it tidier. But, now that we are more comfortable in Tableau Prep, we can use the software to do that work for us.
Drop the “tableauPivot_1” sheet onto the Tableau Canvass. Add a clean step. Rename your clean step to be “adjust <1% values”. In your overview, double click on the “<1%” values and change them to 0.01%. (This is a completely arbitrary choice and totally messes with the accuracy of your data. Proceed with caution.)
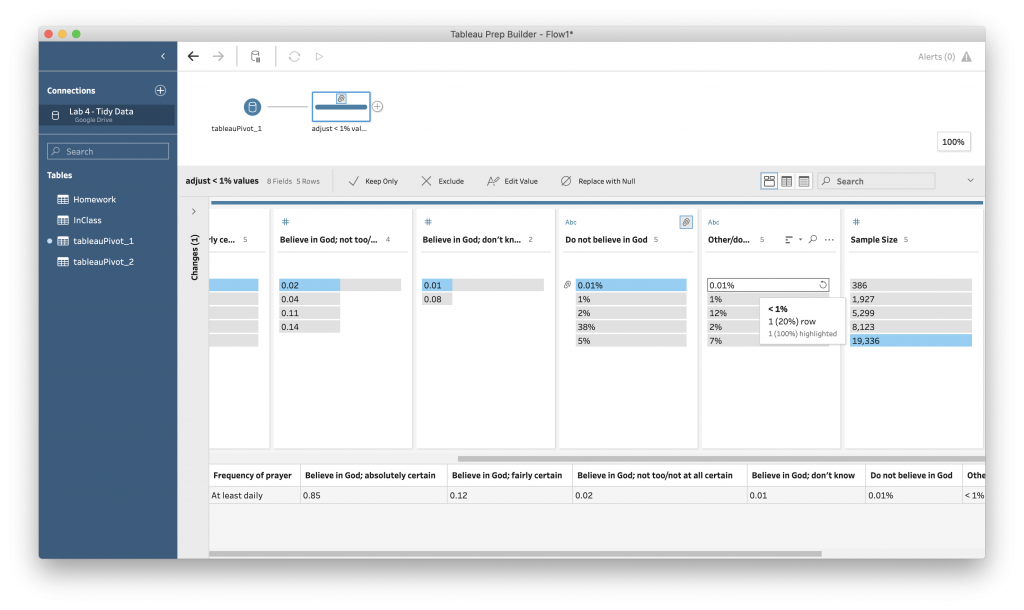
Now, click the “Abc” at the top of those two columns and choose “Number (decimal)”.
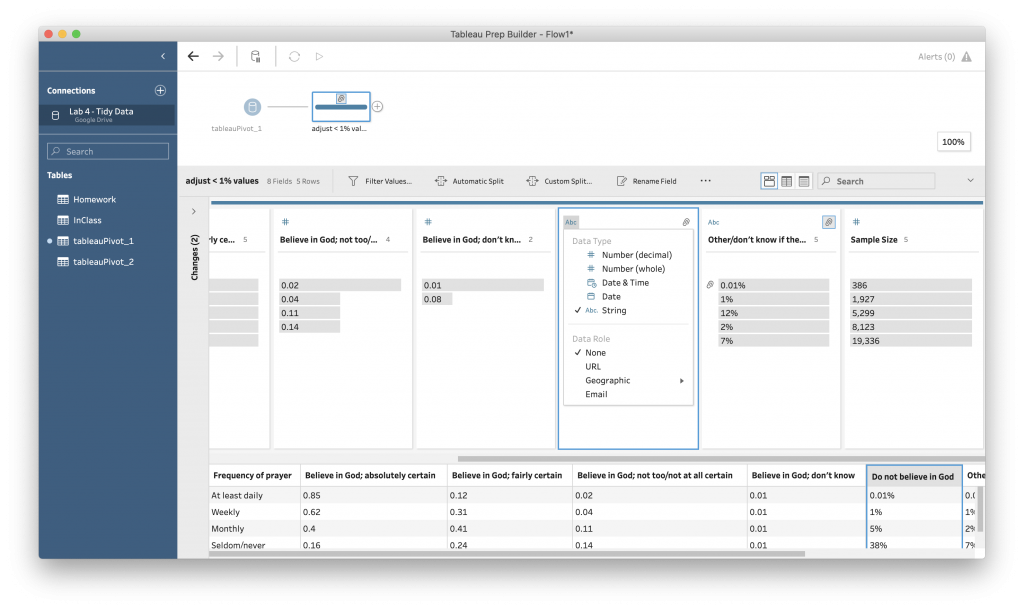
Congratulations. You have done two data cleaning steps. First, we edited our data so that it was consistent. And second, we changed the “data type” so that Tableau now knows that the column contains numerical data. (If you notice, when we changed the type, the number changed from a percent to the corresponding decimal.
Now let’s add a “Pivot” Step.
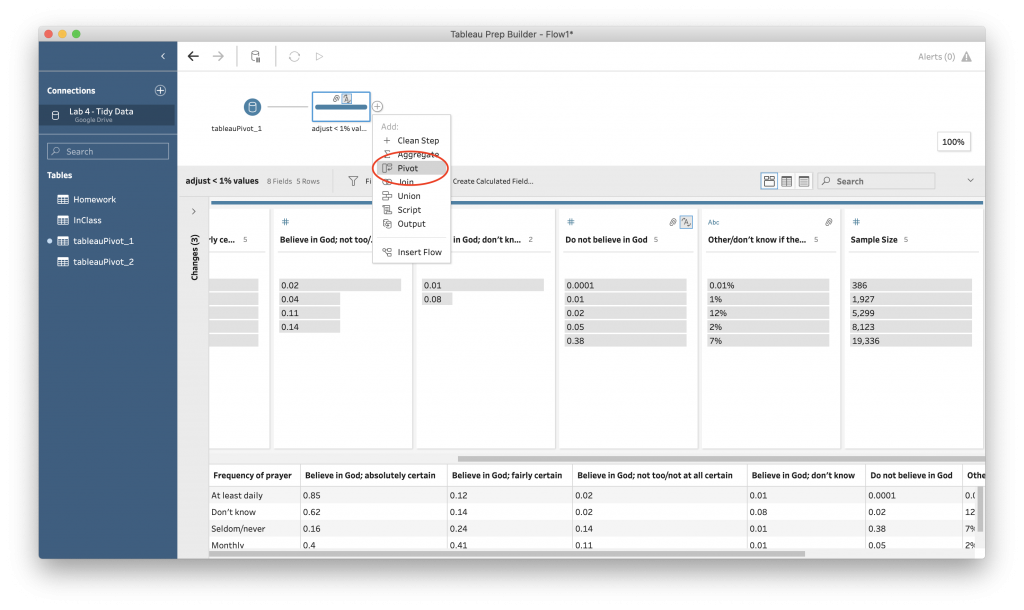
First, we need to identify which information is going to stay as columns in our new, long, table. We decided back in week 4 that this was “Frequency of Prayer” and “Sample Size.” Select the other columns by holding down the command key (mac) and clicking on the cards and then drag the highlighted cards over to the “Pivoted Fields” area.
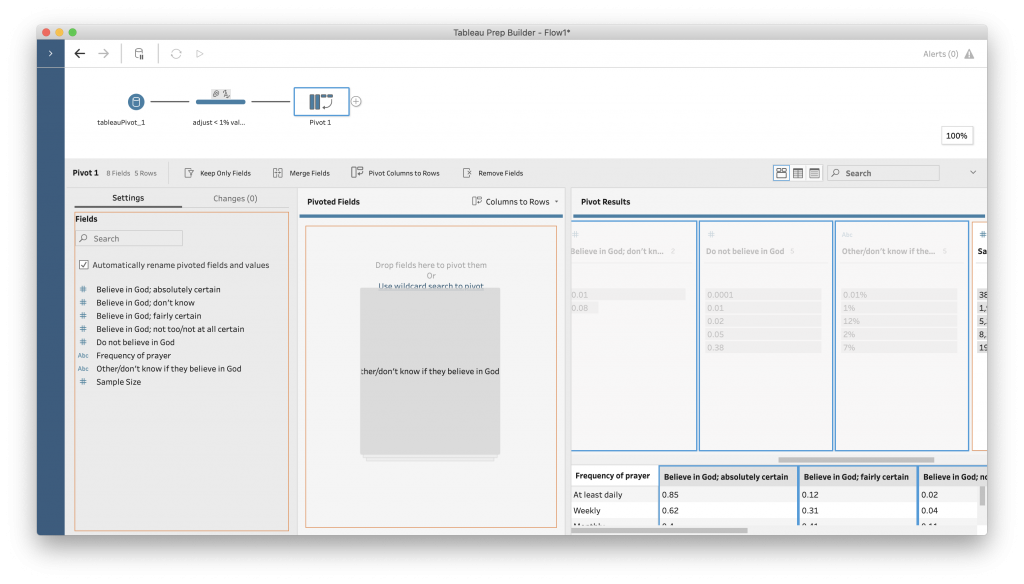
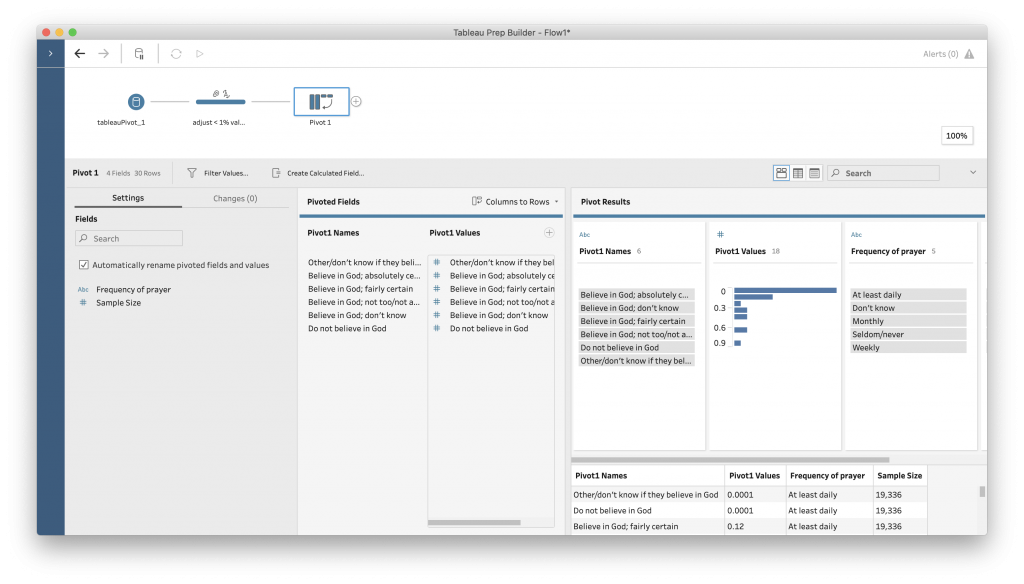
Looking at the preview screen in the lower left column, we see that our resulting data matches what we did in class back in week 4!

Add a new clean step, named “rename Pivot columns.” Double click on “Pivot1 Names” and change this to “IntensityOfBelief.” Double click on “Pivot1 Values” and change this to “Percentage.”
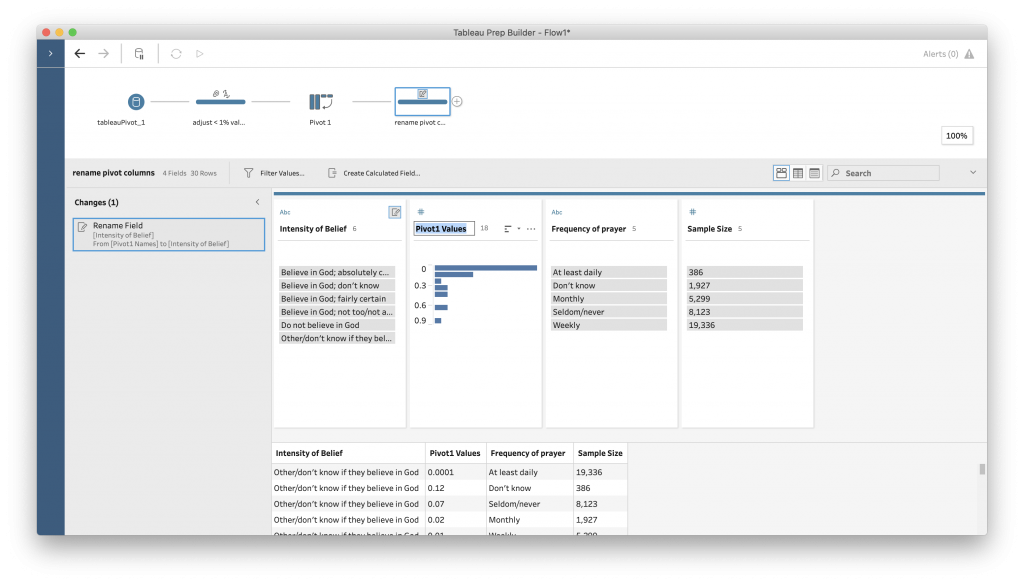
Add another “Clean Step” and name it “CalculateCounts.”
In the middle bar, you should see an option that says, “Create Calculated Field.” Click that, which will open up that box we saw before when we filtered our data to the state of Alabama.
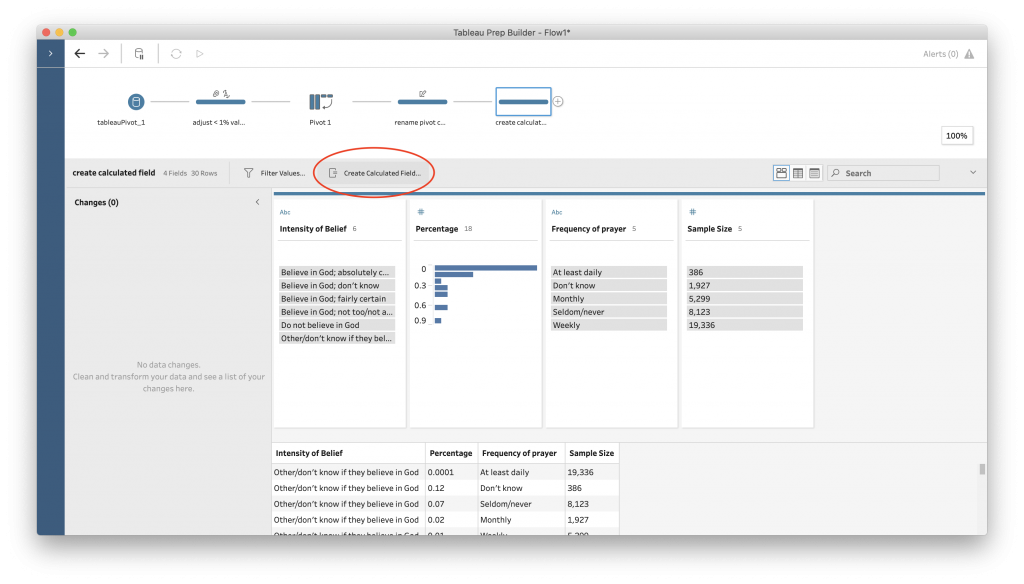
This time we want to do some maths.
Under field name, type in “Counts.” In the box, enter the two column names we want for computing the count from our sample sizes and our percentages, with a “*” in-between ( * is keyboard for multiply.)
[Sample Size]*[Percentage]
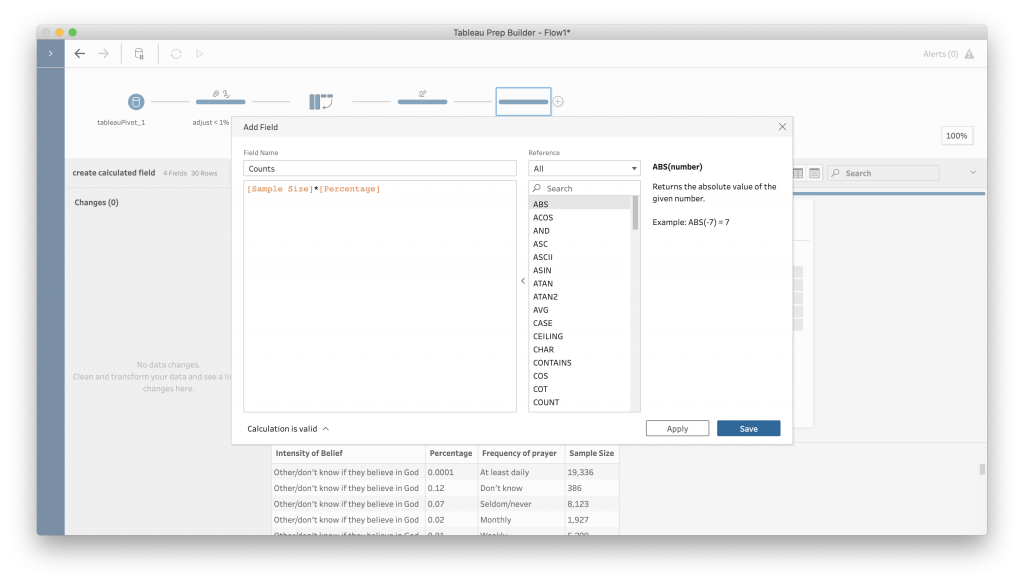
Now, because people don’t come in decimal places, we want to round the result of this to the nearest whole number. Looking under our “Number” options, we can see there is a “ROUND” function built into Tableau. To use it, we type “ROUND” and then put what we want rounded inside of “()”. We also put the equation we want to round first, and then the number of decimal places after, separated by a comma. Whole numbers have 0 decimal places. So this leaves us with :
ROUND([Sample Size]*[Percentage], 0)
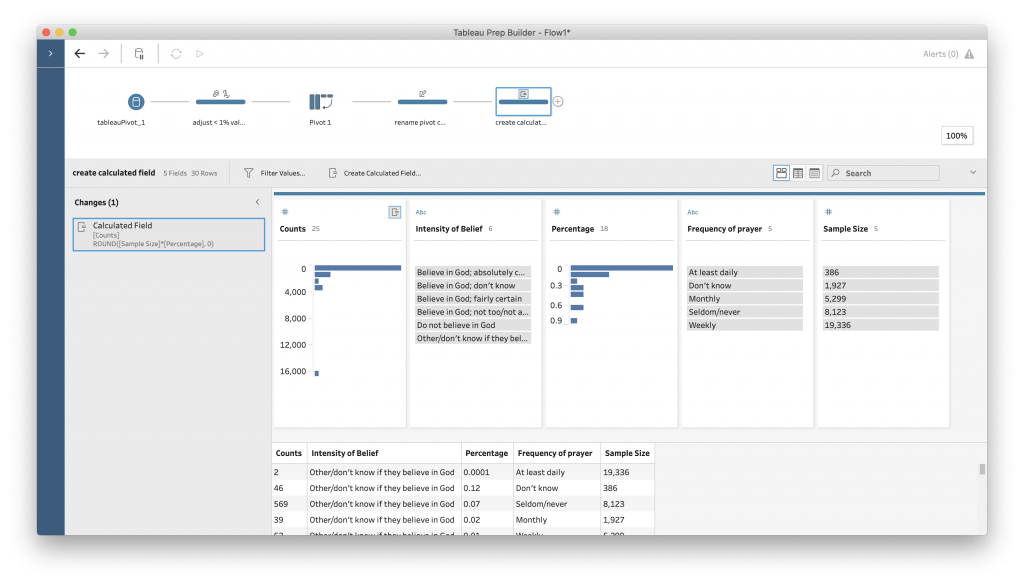
Now at the beginning of our table we have a “Counts” column with the math completed for us.
This is a strange column to start out with, so we can reorganize the columns to make the data easier to ready by dragging and dropping the columns into the location we want them. Let’s put “Counts” at the very end and “Frequency of Prayer” in the second position.
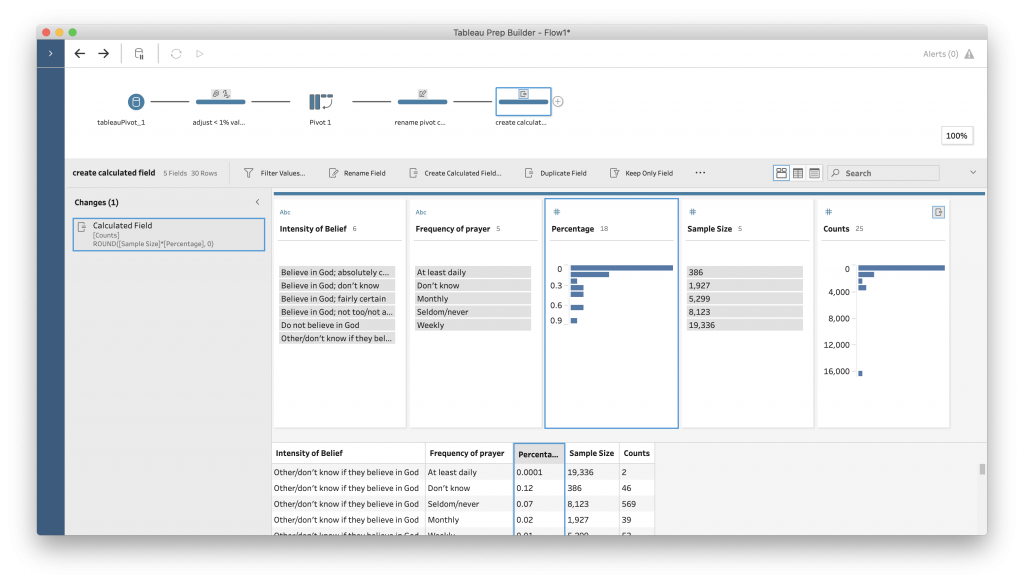
Excellent. Now we have our data clean, organized, and ready for analysis.
These steps have covered a number of different aspects of data cleaning. We have adjusted column names, made data values consistent, pivoted the data to make it tidy, changed data types, and calculated new values.
Data cleaning comes in many varieties, but much of what you will do involves:
- Making data “tidy”
- Making data easier to use
- Making data consistent
- Making data accurate
Practice
I have saved an edited version of the county data file in Box – this is limited to the state of Alabama and has the “coded” information expanded for you.
Load this into Tableau Prep. Then, working together, decide what sort of cleaning the data needs at this point.
Saving your results
Once your data is where you think you want it, add an “Output” step at the end of your flow. You can choose the file name and location for saving your file by clicking “Browse.” In terms of formats, you can use .hyper for this class, as we will be moving between Tableau products. However, you should also save a final version of the data as a .csv for long term storage and for sharing with non-Tableau users.
Additionally, save the “flow” you’ve created so that you have a record of the steps you took to edit your data. Command S, or File -> Save in Tableau Prep will save the flow.
Homework
Try some cleaning steps on the data you are working with for your final project.
Write a brief blog post describing what cleaning steps you decided to do, why you think they will help make the data better for analysis, and how it went. Include a link to the before and after data files. (Save your data files to our class folder in Box. Use the .hyper output from Tableau for the cleaned version.)
Foiled by technical difficulties!
Try updating Tableau Prep and reloading the data files from today. If that doesn’t work, try uninstalling and reinstalling Prep.
If you are still have difficulties, we will figure them out how to proceed on Tuesday.
Lesson for today: when working with tech, time is relative and flexibility is key.