My visualization is map of US counties for everyone to see what counties are in United States. I picked US counties map on Flourish then clicked publish and export to go on Microsoft Word and copy and paste https link to WordPress. I chose US counties map for everyone to see all counties in US. If anyone did not know how many counties and are in a state they see them on that map. US counties map tells readers what all counties are in United States. It helps readers to know what counties are in every state.
Lab 6
I’ve been very interested in the age of local churches in Tuscaloosa. So I went about looking into the age of churches in town. I originally thought that the information would be readily accessible. This was not the case. I actually ran into an Omeka project that was trying/ had tried to do what I am doing! Their information seems to be coming out of old Tuscaloosa newspapers. My information was being pulled out of their stuff and a database of historical markers, which had the inscription on them. I think this communicates the oldest churches in town, and in my very cursory research i discovered some interesting threads that could lend themselves to more data, perhaps an affiliation chart. I used an assignment that displayed time because I thought that most relevant to what I was looking at.
Lab6
My data includes a large list of films (still a work in progress) that include dialogue mentioning the name “Jesus”. This can be in any form or sentence like “Jesus Christ, he’s gotta gun!”. I’ve got a list of about 200 films so far that I’ve organized by genre, year released, the exact time that the line of dialog was delivered, with a small video clip (1-3 seconds) for each line from each movie. I am hoping to have over at least 500 entries for my project. I found it challenging to choose a graph type on flourish. There are not too many options that include media, so I had to take my data in a different direction. I do not think the graph that I chose is the best way to display my data. This graph does not have enough space, and a bunch of the circles cover each other making it hard to see all of the films. I had to make my data more focused by distinguishing the quotes between “Jesus” and “Jesus Christ”. I still am unsure of the best platform for my data, but flourish definitely helped me learn what won’t work.
https://public.flourish.studio/visualisation/11478898/
Lab 6
The graph I made is looking at the author’s affiliations, universities or organizations, and the dates of the publications (2015-2019). First, I copied the publication dates from the author spreadsheet into a google spreadsheet then I did the same with the affiliations. Using the two columns, I made a pivot table where the publication dates were in the row section and affiliations in the columns. Using the value option, I selected the calculated field using the affiliations information. For this project I chose a column chart (stacked) from Flourish because it looks at the number of articles published on a specific date and allows for looking at different things within that information. The graph’s x-axis is the publication dates and the y-axis is the number of authors published on that date subdivided by the number of authors from each university or organization. I initially tried to use the data from 2010-2021 but it was so large Flourish would not display it properly so I reduced it down to the first five years in the document.
I think the information my graph communicates to the viewers is the number of authors who published articles and the affiliations of the authors. It looks like most of the authors are affiliated with colleges or universities, but there are some who are from organizations, like the American Academy of Religion, and independent scholars.
Lab 6
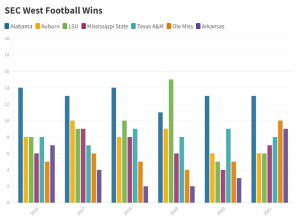
Well, I tried to figure out what I did wrong with the visual that I made from class this past week, but I could not do it. I had to fall back on something last minute since I was not sure where to pull new data from last minute like this. I decided to chart the wins off all the SEC West football teams wins over the past 5 years and divide them up by teams. Of course Alabama is predominantly on top (roll tide), but there was some fluctuation between between LSU, A&M, Auburn, and Ole Miss. Referring to the assignment in class, it is far more complicated than the graph that I have at the bottom since there was so much more data. I did learn a lot using Flourish and how it will relate to Omeka for my final project. My final project will likely be a some sort of bar graph representation, so I am glad to have worked with it when it for this small representation.
Lab 6
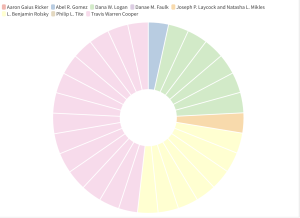
The data visualization below looks at the authors’ respective citations in issues 47.3-4 of the Bulletin. It took a lot of tweaking to correct this data once it was pasted into flourish– due to duplicates. I also had issues with the text being pasted upside down in the spreadsheet so that was super fun. I chose a pie chart for this particular data set because all of the other ones did not show any difference in columns. I assume this was mainly because the issue number was all the same, so the pie chart shows the repetition and amount that each author was present. It easily shows that Cooper holds about half of all citations and other authors like Logan and Rolsky were the next most prominent in this one specific series.
Lab 5
Mukurtu seems to be a very useful site, similar to Omeka. Mukurtu does have some unique feature such as:
- media assets
- communities and protocols
- item sharing
- traditional knowledge field
- Cultural narrative field (used for historical context)
- keywords
Mukurtu is a site aiming to empower communities to manage, share, narrate, and exchange their digital heritage in culturally relevant and ethically-minded ways. This is different from Omeka in that Omeka is open to communities such as religious studies. Mukurtu seems to be very good at the specific topics they aim to share about. Omeka might be a better platform if you are considering doing something not related to culture and ethnicity. However, if you are planning on presenting data about what Mukurtu is aimed at, then it will be a better site to use.
Lab 5
The fields that the two platforms share in function are these. If they call it something else I’ve noted that.
Title, Description (called Summary), Creator, Source, Publisher, Date (original is added), Contributor (called Communities and protocols), Rights (called Item sharing settings), Relation (called category), Format, Language, Type, identifier, Coverage.
The Omeka model is very broad while the Mukurtu model is tailored specifically to cultural objects. The exclusive labels were reflective of this.
Cultural narrative, Traditional knowledge, Traditional Knowledge labels, People, Transcription, Geocode Address, Latitude, Longitude, Location Description, Collections
Lab 5
Mukurtu is a project and platform that empowers communities to manage, narrate, connect, label, and share their digital heritage materials, history, knowledge, and stories.
Mukurtu has several metadata fields that are unique to it in comparison with Omeka. The fields I found that were unique were Media Assets, Communities and Protocols, Category, Cultural Narrative, Traditional Knowledge, Traditional Knowledge Labels, Licensing Options, People, Transcription, Location Description, External Links, Collections, Community Records, and Book Pages. There were also a few that were not precisely labeled or described the same but seemed to be similar metadata fields between Omeka and Mukurtu. The field of coverage within Omeka covered the space and time of the items while in Mukurtu, it was separated into original date and original date description, geocode address, latitude, longitude, and location description. One of the fields in Mukurtu, Item sharing settings, seemed similar to the public checkbox when an item is added in Omeka but it had different access settings. Keywords in Mukurtu seemed similar to the tags in Omeka.
Omeka is very generalized and compared to Mukurtu, it does not have very many fields or places to really document details. I think in comparison, Mukurtu is more focused on the item, the cultural details about the item, and the cultures and communities. It has more categories and where Omeka combines metadata like time and space into a single field, Mukurtu separates it into a very specific location and time or has a text boxes for additional description.
Lab 5
Mukurtu has a ton of additional metadata that Omeka does not. For example Mukurtu includes metadata fields like: Media Assets, Cultural Narrative, Traditional Knowledge, and Communities and Protocols. This appears to me as though Mukurtu is a much more specialized system than Omeka, or rather that it was designed specifically for this purpose.
It seems to me that Omeka is supposed to be a relatively barebones system designed for projects focused on large scale projects where the details of community aren’t as strongly expressed. The Omeka model for gathering data appears also to be focused mainly on the collection of various texts rather than media as a whole as is demonstrated in the Mukurtu model. Moreover, Mukurtu demonstrates a bias towards a specific community and as such their metadata is set up to expose the intricacies of that community.